Chartwright · macOS · Beta
The research desk
you never had.
17 AI analysts.
Turn a ticker basket into a sourced research brief, a reproducible backtest, and paper-portfolio follow-up. Your workspace is local; live data and any cloud model you configure use the network.
macOS 14 Sonoma or later · Apple Silicon & Intel · No account required
At a glance
What is Chartwright?
Chartwright is a native Mac research desk for building sourced market theses, running reproducible backtests, exploring scenarios and tracking a paper portfolio. It supports local or user-configured cloud models and is a research tool, not a brokerage or financial adviser.
- Platform
- macOS 14 Sonoma or later; Apple silicon and Intel
- Best for
- Structured market research, backtests, scenarios and paper-portfolio follow-through
- Processing
- Saved work stays on the Mac; local and user-configured cloud inference are supported
- Availability
- Private beta; access supplied to approved testers
Product facts reviewed against the current application repository on . See the verification method and corrections policy.
What is Chartwright?
Chartwright is a native macOS research desk that turns a ticker basket into dated evidence, structured theses, reproducible backtests, and paper-portfolio follow-through. Specialised research roles examine fundamentals, technical signals, macro context, risk, and other available evidence before a portfolio-manager role assembles the findings. The app also includes interactive charts, scenario work, watchlists, and a paper portfolio. The workspace and saved results live on your Mac. Live market sources require a connection, and prompts are sent to a cloud model only when you configure one; local models are supported for on-device inference. Chartwright is currently in private beta and is not a brokerage, trading service, or financial adviser.
A research trail
you can inspect.
Market evidence, model output, backtest assumptions, and paper-portfolio decisions stay connected instead of disappearing into a chat transcript.
AI Research Engine
Every analyst you wish you had, on demand
17 AI analyst agents run simultaneously on every ticker you research — each modelled on a different legendary investor or analytical discipline. They don't coordinate. Each one forms an independent view, then a Portfolio Manager synthesises the consensus.
- 11 legendary investor personas: Buffett, Munger, Lynch, Burry, Wood, Ackman and more
- 6 systematic specialists: technical, valuation, fundamentals, sentiment, growth, news
- Each analyst outputs a signal, confidence score, and full reasoning trail
- Bull vs. Bear debate rounds surface conflicting views before the final call
- Evidence drawer keeps available source links beside each analyst output; users still need to verify every citation and interpretation
Charts & Market Data
Professional charting, no subscription
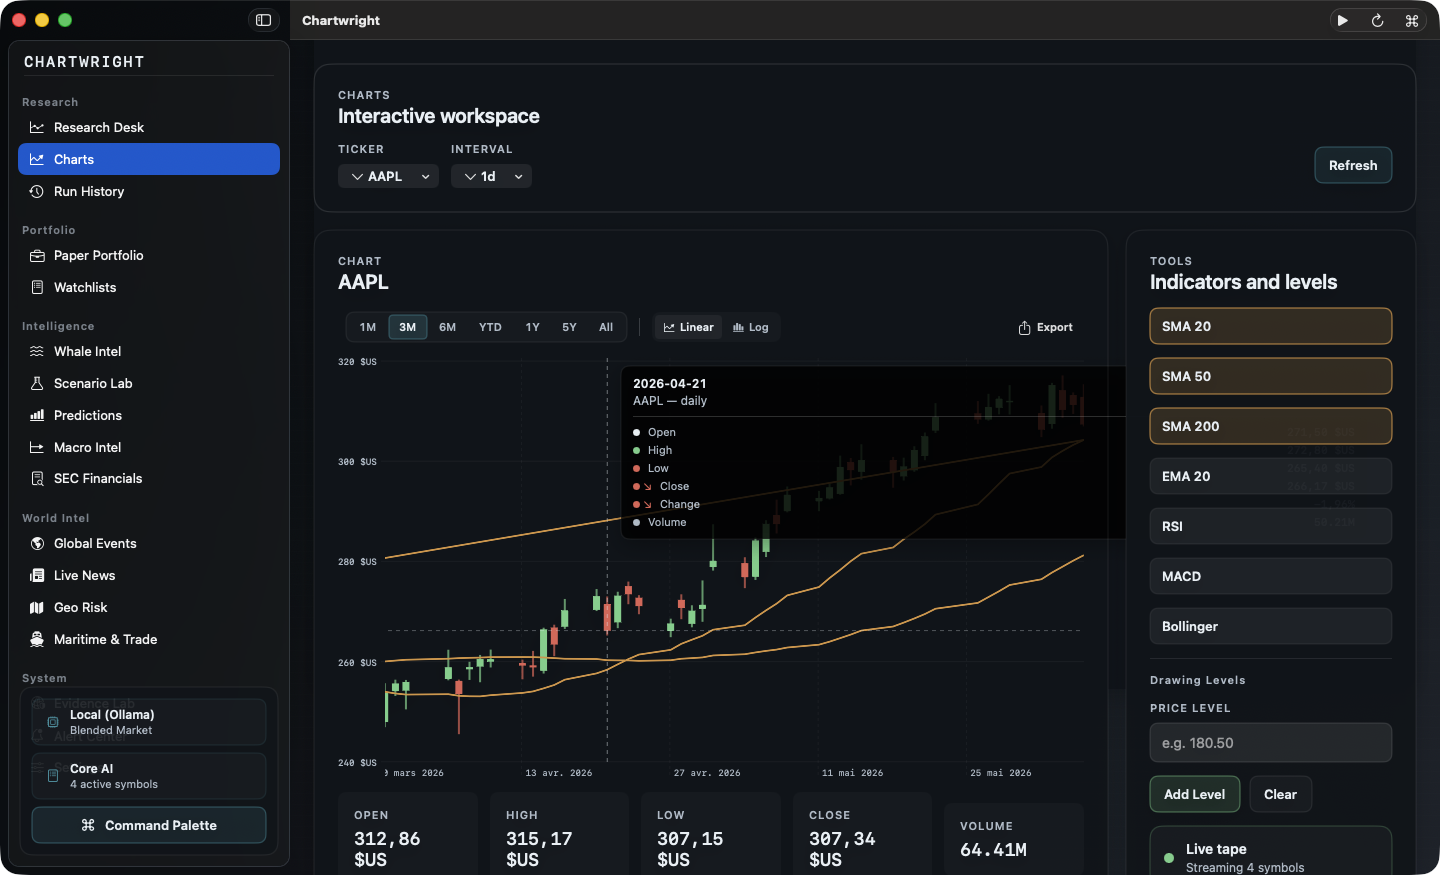
Interactive candlestick charts with a full suite of technical indicators built in — no Bloomberg terminal required. Live quotes stream directly into the app from multiple providers.
- Candlestick charts with zoomable scroll, crosshair tooltip, and OHLCV readout
- SMA 20/50/200, EMA, Bollinger Bands, RSI, MACD overlays
- Support & resistance levels plotted automatically from backtest data
- Live streaming quotes with configurable price alerts for any ticker
- Historical data going back years via Yahoo Finance integration
Whale Intelligence & Scenario Lab Quant
Inspect public filings and on-chain signals in one place
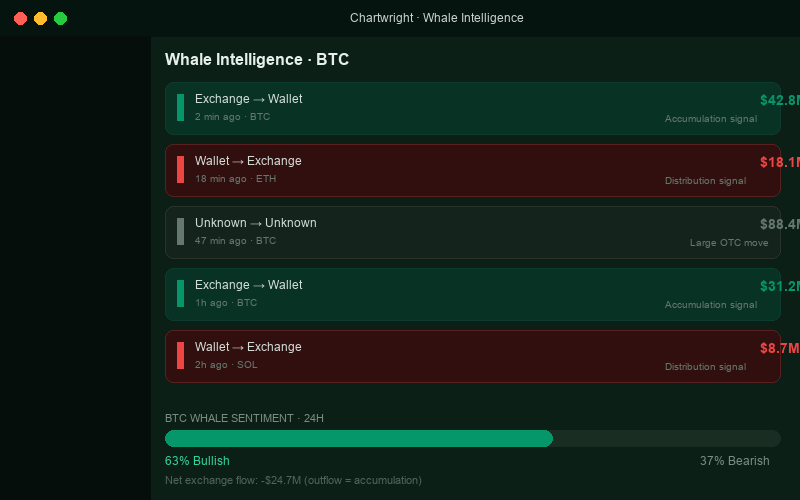
The Quant tier adds real-time on-chain whale transaction monitoring and a multi-agent Scenario Lab that stress-tests your portfolio against any macro event you can describe — "Fed hikes 75bps", "China bans crypto", anything.
- Real-time whale alerts across Bitcoin, Ethereum, and 15+ blockchains
- Net exchange flow, sentiment score, and largest-tx tracking per asset
- Scenario Lab: describe any event — "Fed hikes 75bps" — and simulate portfolio impact with up to 200 AI agents
- Insider trading signals: SEC Form 4 filings tracked for all watchlist tickers
- Volume anomaly detection: z-score alerts on unusual trading activity
Backtesting & Paper Trading
Test historical assumptions before paper-tracking
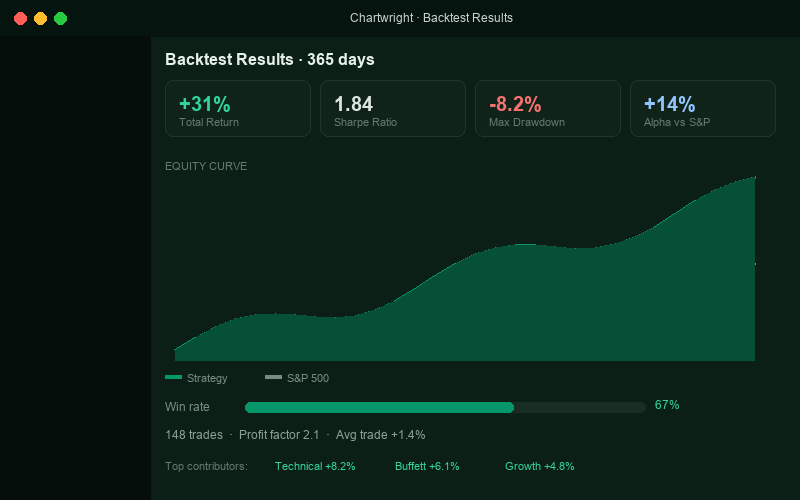
Every research run generates a full backtest automatically. See how your AI-derived portfolio would have performed historically — Sharpe ratio, max drawdown, alpha, trade log, and per-analyst contribution breakdown.
- Automatic backtest on every run — no manual setup required
- Sharpe, Sortino, max drawdown, win rate, profit factor
- Benchmark comparison: S&P 500, Nasdaq 100, or crypto basket
- Per-analyst return attribution — know which agents added value
- Paper portfolio tracks AI recommendations forward in real time
Research in three steps
Move from a research basket to a sourced record, historical context and a hypothetical paper thesis.
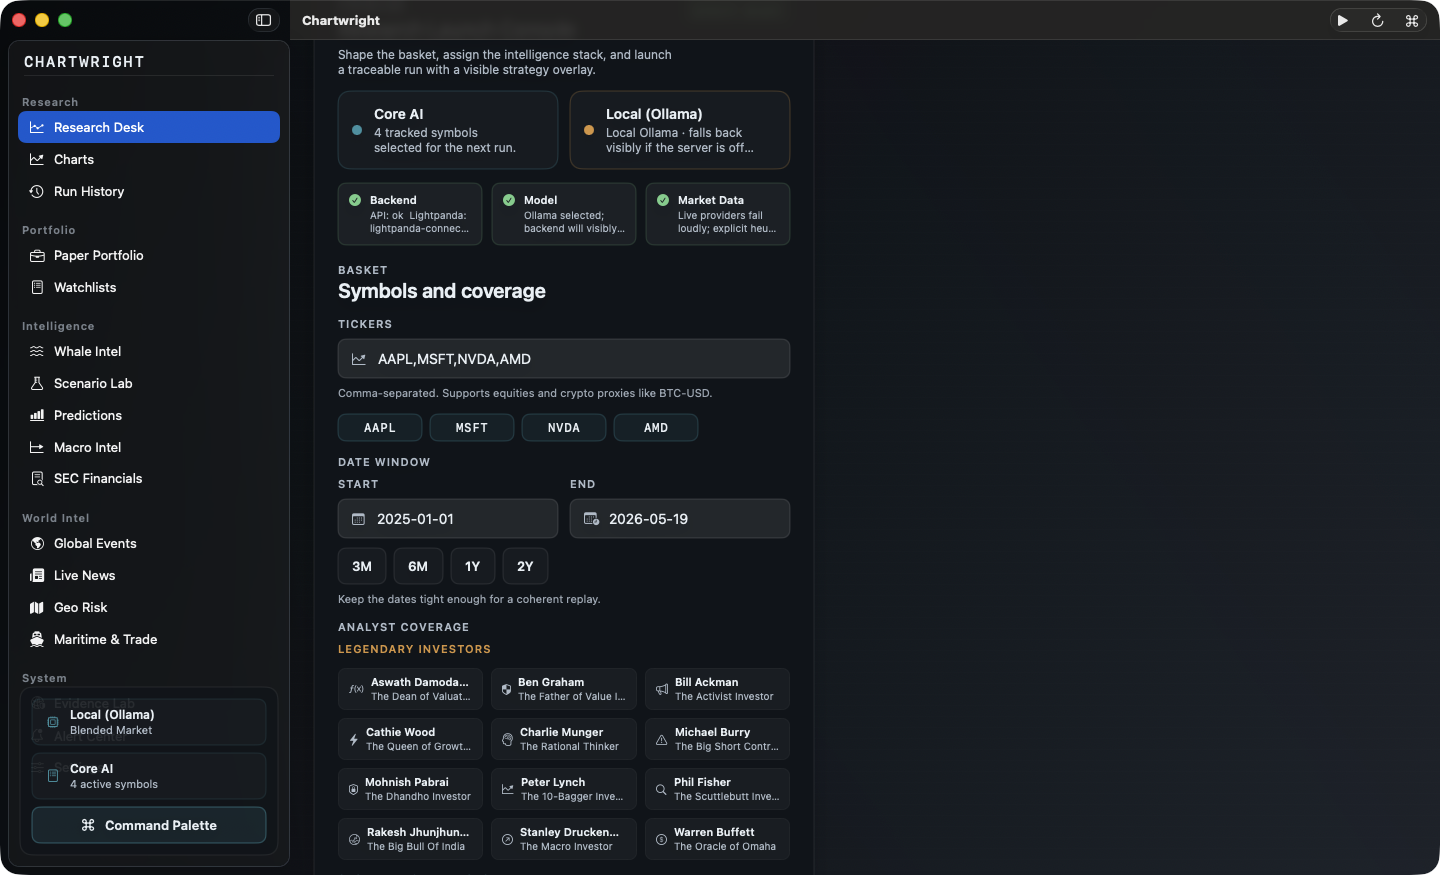
Enter your tickers
Add supported stock, ETF or crypto symbols to the research desk, choose a date range and select the research roles relevant to the question. Public plans and entitlements are not live.
AI analysts deliberate
Chartwright fetches live market data, SEC filings, and news, then routes each ticker through all 17 analyst agents simultaneously. Each analyst forms an independent view — then a Portfolio Manager synthesises the consensus.
Act on the results
Review recommendations, read analyst reasoning, check the backtest, and add positions to your paper portfolio. Export to Excel, or run a Bull vs. Bear debate to challenge a conviction.
Your research desk.
Your machine.
Your data.
Chartwright is local-first: the workspace, portfolio, watchlists, and saved research live on your Mac, and the application backend runs over localhost. Live market sources receive the requests needed to retrieve their data. A cloud model receives prompts only if you configure one; a compatible local model keeps inference on the Mac.
Start free. Upgrade when you're ready.
No credit card required to start. Upgrade, downgrade, or cancel at any time.
| Feature | Free$0 | Pro$199/yr | Quant$499/yr | Lifetime$899 once |
|---|---|---|---|---|
| Research runs per day | 5 | ∞ | ∞ | ∞ |
| Tickers per run | 3 | 20 | 20 | 20 |
| All 17 AI analysts | — | ✓ | ✓ | ✓ |
| Interactive charts & indicators | ✓ | ✓ | ✓ | ✓ |
| Automatic backtesting | — | ✓ | ✓ | ✓ |
| Paper portfolio & order tracking | — | ✓ | ✓ | ✓ |
| Bull vs. Bear debate rounds | — | ✓ | ✓ | ✓ |
| Excel report export | — | ✓ | ✓ | ✓ |
| Whale Intelligence & alerts | — | — | ✓ | ✓ |
| Scenario Lab (200-agent simulation) | — | — | ✓ | ✓ |
| Insider trading signals (SEC Form 4) | — | — | ✓ | ✓ |
| Macro Intel (FRED data) | — | — | ✓ | ✓ |
| SEC EDGAR XBRL financials | — | — | ✓ | ✓ |
| Local LLM (Ollama + MLX) | ✓ | ✓ | ✓ | ✓ |
| All future features | — | — | — | ✓ |
Free
Planned beta tier.
- 5 research runs per day
- Up to 3 tickers per run
- Interactive charts & indicators
- Live price alerts
- Watchlists & local LLM
Pro
Planned annual licence.
- Unlimited research runs
- 20 tickers per run
- All 17 AI analysts
- Full backtesting engine
- Paper portfolio tracking
- Bull vs. Bear debates
- Excel report export
Quant
Planned annual licence.
- Everything in Pro
- Whale Intelligence & alerts
- Scenario Lab (200 agents)
- Insider trading signals
- Macro Intel (FRED)
- SEC EDGAR XBRL financials
- Priority support
Lifetime
Planned one-time licence.
- Everything in Quant
- No monthly or annual fee
- All future features included
- Founding member badge
- Beta access to new features
- Priority support, always
Private-beta pricing shown here is the current product plan, not a live offer. Final regional price, renewal, tax, and refund terms will be shown before purchase.
Common questions
Request Chartwright beta access.
The current build is shared through a controlled beta channel while release and pricing details are validated.
Targets macOS 14 Sonoma or later · Exact build and hardware requirements are included with the beta invitation